
30 Premium TradingView Indicators
Get Jared's Custom Indicators He's Developed Over 10+ Years
What is TradingView?
TradingView is the #1 most popular charting platform online, covering over 100,000 global assets used by millions of traders and investors from around the world.
All of our 30 custom indicators work inside the TradingView charting platform,
setup is easy, anybody can do it and only takes a few minutes.
If you don't already have a TradingView account, then first sign up using our link
to get a special discount https://www.clickcapital.io/tradingview
Descriptions of Our 30
Custom TradingView Indicators
Below are descriptions and snapshots of all our custom indicators. With all these indicators you can setup real time alerts inside your TradingView account so you can be notified on your phone, email or other methods to let you know if an indicator has given a trading signal even if your computer is turned off.
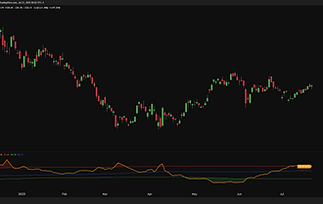
DARK POOL %

The Dark Pool % indicator gives you a rare window into what’s happening beneath the surface of the market — activity that isn’t visible on standard charts. It tracks subtle shifts in off-exchange volume to help identify moments when sophisticated players may be quietly building or exiting positions.
Unlike vague block trade scanners that often create more questions than answers, this tool delivers a clean, intuitive signal updated daily. Whether you're a swing trader or a long-term investor, it can help you catch accumulation early or recognize signs of distribution before price reacts. This is one of our most powerful edge tools — and it’s available exclusively to Click Capital members.
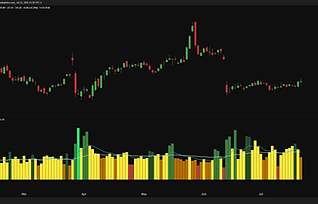
RETAIL INTEREST INDEX
The Retail Interest Index is designed to measure when retail traders are driving a stock — and when that enthusiasm is wearing off. Using a proprietary blend of volume and momentum-based inputs, it assigns a clear 0–100 score to show how hot or cold retail sentiment is at any given moment.
It helps you find early-stage breakouts, avoid late-stage hype traps, and better time your trades around where the real action is. Whether you’re riding waves of speculative momentum or trying to fade overhyped moves, this tool gives you the clarity to make smarter decisions. It’s a simple, visual edge — ideal for active traders navigating fast-moving markets.
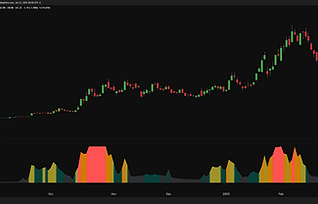
INSTITUTIONAL BUYING %

The long awaited and highly valuable Institutional Buying % Indicator, a first on TradingView. Get unique insights into what the "smart money" is doing in all assets around the world! There's no large price tag or ongoing costs associated with this indicator like similar data out there.
This takes trading to a whole new level and without the huge price tag normally associated with this premium data. Look for areas of shaded green on the indicator for evidence of large trader buying, orange for the neutral zone, and red for signs the big guys are selling.
BUY SELL BANDS
Determining when to buy and sell is hard, and that's why we designed the indicator Buy Sell Bands which tells you exactly when to buy and sell. It's based on a mean reversion trading strategy that buys when price is oversold and sells when overbought and exit back at the mean.
Trading signals are shown on the chart and this indicator works on every asset and timeframe. This is the best technical indicator for swing trading and day trading all assets. Investors can also use this indicator for long term entry & exit signals.

TREND CANDLES
.png)
This very popular indicator makes Trend Following easy on any instrument and timeframe. Whether you trade stocks, forex, futures, crypto or any other asset in the world you can use Trend Candles Indicator to tell you exactly when to buy and sell.
It will keep you in all good trends and let you know when to get out, you can setup real time alerts to your email/SMS and with the visually appealing design all your candles are either green or red so you'll always know the trend by looking at the chart.
3D TRAILING STOP

We've all heard of trailing stops and there effectiveness in keeping us in the prevailing trend, for example trailing stops that are based on a % drop, or a multiple of the ATR or a X day breakout below a recent low.
With our custom indicator 3D Trailing Stop, its based on three things; the Trend, Volatility and Volume making it a 3 dimensional indicator, hence the name 3D Trailing Stop. This indicator measures the trend in a unique way to keep you in trends longer whilst getting you out of changing trends earlier!
SEASONALITY FORECAST

Seasonality is all around us, in business cycles, weather, commodity demand/supply and in markets too. The same patterns can repeat time and time again giving traders an edge ahead with their trades.
With our Seasonality Forecast Indicator you will see right on every chart you look at what the expected % return for any amount of days going forward, you can adjust it all the settings. Knowing seasonal trends can add an edge to all of your trade entries.
QUANT FACTOR SCORES

Academic research has proven that the primary drivers of any stocks returns are; Momentum, Growth, Quality, Value & Volatility. We've created a highly valuable fundamental indicator, Quant Factor Scores that shows scores for these 5 factors for any stock in the world!
Each factor is rated either; Great, Good, Average, Poor or Bad. Instead of spending hours and hours pouring over Financial Statements, you'll be able to easily identify winning and losing stocks.
STOCK FAIR VALUE

In a first on TradingView we have our Stock Fair Value Indicator which uses fundamental data to generate a fair value per share price to pay for any stock worldwide. It's our own unique formula using Wall St analyst estimates of future earnings, business growth rates, and balance sheet items to calculate a fair value.
Right next to the indicator shows you whether the stock is currently undervalued or overvalued and by how much letting you easily see whether the stock you're buying is good value or not. A must have for all serious stock investors!
BUSINESS QUALITY SCORE

No more pouring over balance sheets trying to check the quality of a business you're interested in, now with our Business Quality Score Indicator you can see with a quick glance how strong any stock is. Measuring the profitability, efficiency, safety, debt, and liquidity all rolled into 1 easy score you will know right away if your stock is worth investing in.
You can also use this indicator to monitor your current investments to see if the business quality is improving or declining. Use in combination with the Stock Fair Value indicator to find quality businesses that are also cheap.
STOCK CRASH RISK

When stocks exhibit both extreme price action sentiment and valuations they're vulnerable to crashing and that's exactly what the Stock Crash Risk Indicator lets you know. With a measurement between 1 for very low risk and 10 for very high risk you can tell straight away what the chances are a stock you're interested in might crash over coming months.
It's remarkably accurate in forecasting stocks that will crash, you can use it to steer clear of all dangerous stocks and stay in more safer ones.
SHAREHOLDER YIELD

Dividend yield is so 2010, take your investing into the future with the modern Shareholder Yield indicator. This combines Dividend Yield, Share Buyback Yield and Debt Reduction Yield into one easy to see reading. Our indicator shows whether it's Good (green), Average (yellow) or Bad (red). Look for stocks with a Shareholder Yield above 5% as being Good.
Empirical research has shown that Shareholder Yield (SY) is far superior to Dividend Yield, with top SY companies delivering much higher returns on average than not.
SMART SIZING
In addition to knowing when to enter and exit a trade, the next most important thing is risk management, you have to have correct position sizes so that you have an equal amount of risk on all of your trades.
With our Smart Sizing Indicator you will see right on every chart you look how many units you should trade for that particular instrument at that point of time based on the volatility of the underlying asset you're trading.

VWAP EXTREMES
.png)
The Volume Weighted Average Price (VWAP) is the #1 used indicator by day traders and other professionals to determine where the daily "market price" lays, you want to pay attention to pullbacks to VWAP and when price gets too far from it.
You can use the VWAP Extremes Indicator to show you what the most extreme % distances price has been from VWAP over a given number of bars, this can help determine levels of overbought or oversold to add strength to your entries.
DYNAMIC SWING INDEX
The Dynamic Swing Index (DSI) is a superior oscillator indicator designed to show you oversold and overbought levels on any asset and timeframe.
The oversold and overbought levels adjust to every asset and current market environment, hence the name Dynamic. You can also use it to find divergences in price and the indicator.
There's much more going into this indicator than all standard oscillators and it will let you know when price is ready to turn.

SP500 OSCILLATOR

The SP500 Oscillator is designed to determine when the S&P500 Index is oversold or overbought. It uses a multitude of data points, both technical and fundamental.
Things like market breadth, volatility, retail sentiment and other things to show you when the market is at extremes.
You can use this indicator to help you determine what your positioning in the market should be and when to be cautious of the market reversing trend.
REVERSAL SIGNALS
Reversal Signals will help identify potential reversal points in the market by showing up to 5 consecutive buy or sell signals when it has determined the market could be near the end of swing high or low. It can be used on any asset and timeframe, however it's best suited for daily charts and when markets aren't in strong parabolic trends.
It is also useful to determine strong trends when a clustering of signals fails. Also look for clustering of signals at levels of significant support and resistance to add weight to the signal.

OPTIONS IV FAIR VALUE
The Options IV Fair Value Indicator is designed primarily for options traders however it can also be used by other traders to gauge what the expected volatility is in any asset.
For options, you can use it to see what a fair price is for the implied volatility (IV) of near dated at-the-money options as IV is the main determinant of how expensive or cheap options are. You can use this indicator as a strong indicator of what the asset's expected volatility is over the near term, expressed as a annualised percentage, the same as IV values in all option broker platforms.
KEY S&R ZONES

This indicator automatically displays key support & resistance zones on every chart. It's a unique formula designed to show significant turning points in the market where big money may come in again to defend a level.
Using a volume analysis it will shade areas of the chart where an asset may find support or resistance, these can be good spot to enter new trades and also put your stop losses outside of the key zone. This indicator is a must for every serious trader in order to identify the most important levels in any market.
HIDDEN DIVERGENCE
This is our unique indicator to find hidden divergences in price, it's completely different from traditional oscillators that find divergences. Hidden Divergence is designed to be used on stocks and ETFs on the daily timeframe.
Look for double bottoms or consolidations after large moves and for the indicator to point the other way, ideally you want to trade in the direction of the divergence. Also positive readings on the indicator can be considered bullish for the asset and negative readings can be considered bearish for the asset.

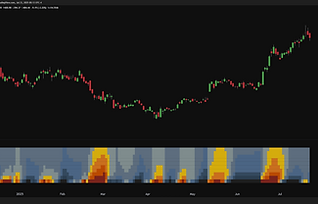
VOLATILITY HEATMAP
The Volatility Heatmap is a visual tool that highlights the natural rhythm of volatility — when it’s contracting, and when it’s about to explode. Instead of relying on complex calculations, this heatmap makes it easy to see when prices are coiling tight and ready to spring.
High-compression zones appear clearly, helping you avoid dead periods and focus on setups with explosive potential. Whether you’re swing trading or playing short-term breakouts, this is your go-to map for timing volatility like a pro.
MARKET RISK ON/OFF

This indicator shows you when it may be a good time to buy hedges or reduce long exposure in your portfolio. The Market Risk ON/OFF Indicator shades the entire chart Green for Risk-On Mode or Red for Risk-Off Mode.
It's calculation is based on 3 signals; the price action of the S&P 500 Index, Market Breadth & VIX Futures Term Structure. It successfully helped traders avoid the very sharp and hard covid crash in Late February of 2020. It gives you an idea of when may be a good time to reduce long exposure.
SECTOR TRENDS TABLE
The Sector Trends Table Indicator gives you a quick birds eye view at all the current trends in the market and sub sectors. It's completely customizable to display any symbols you want and shows where the last price of each asset is in relation to the 5, 20, 50 and 200 bar moving averages.
You can use this indicator as a heatmap to see where the strongest and weakest trends are in the market and overall what the trend is in the market as a whole.

WAVEFLOW

Our WaveFlow Indicator is used to determine what the short term trend is in any asset and on any timeframe. You'll see a green wave indicating a uptrend and a red wave for downtrends.
Pay attention to when the wave coils up as in can indicate a upcoming change in trend. Also look for potential reversals when the entire candle is outside the wave, showing the price is very stretched. A very helpful visual aid for your understanding of the markets!
MOMENTUM THRUSTS
The Momentum Thrusts Indicator is designed to be used on any timeframe to identify strong moves. You can get eal time alerts in TradingView to get a sound or popup on your screen when a buy or sell signal is given.
It's designed to let you know when there's hot momentum in any asset that's expected to continue for a little bit longer. The signals will generate mid-bar, not just on bar close. This is a popular indicator amongst active traders in stocks, futures, forex and cryptos.

EARNINGS YIELD PREMIUM
The Earnings Yield Premium indicator shows you a company's earnings expressed as a percentage over the risk-free rate of short term bonds. That's where the "premium" in the name comes from.
Ideally as investors, we want to invest in stocks that have a good earnings yield compared to bonds. Like all our indicators, it works for stocks from all around the world giving investors a quick way to compare the valuation of a stock versus bonds.

ECONOMIC TRENDS TABLE
The Economic Trends Table indicator is something every trader and investor should reference even though economics is considered a "boring" subject it has an effect on us all whether we're aware of it or not.
Inside this indicator is 13 different economic data points along with our proprietary trend algorithm to determine if each data point is "bullish" or "bearish" for the economy, and thus by extension, the stock market.
Down the bottom is a Overall Score for the economy to let investors know whether it's expanding or contracting to help determine what our positioning should be.

SECTOR BREADTH TABLE
The Sector Breadth Table gives actives traders and investors are deeper look underneath the hood of the stock market. It shows what % of stocks are above their 5, 20, 50 and 200 moving averages for the top 10 most important stock sectors.
You can now easily spot the strongest and weakest sectors, and more importantly, watch market rotations happen in real time as big money flows from one sector into another.
This is possibly one of our best and most valuable indicators we've ever developed.

TREND STRENGTH

Designed to be used in conjunction with the Buy Sell Bands or with any trading strategy, the Trend Strength indicator tells you whether the market is currently in a trending or ranging mode. Ideally when putting on reversal trades we want to do when the market is ranging or coming out of a long trending environment.
This indicator will give you a numerical measure of the strength of the trend and is great for quick and easy visual reference to any market and timeframe as to how strong the trend is or isn't.
MY PORTFOLIO MONITOR

My Portfolio Monitor is great for tracking all your investments and portfolio. It's very easy to setup, you just enter your stocks/ETFs, quantity purchased, average price paid and the indicator does the rest!
It will automatically update in real time to show you daily % and $ changes, what your total $ and % gain/loss is, the % weight of each position in your portfolio plus other cool things like whether each asset is above/below it's 150 MA and the RSI reading for each too. Get a bird's eye view of your money!
How To Use Our Custom Indicators
Getting access to our indicators is easy and anybody can do it today by following the 4 steps below;
1
If you don't already have a TradingView account then sign up for a free account at www.tradingview.com - The #1 charting platform online used by millions of traders.

2
Enter your TradingView username from your profile page into the order form below along with your email address then proceed to checkout.

3
Once we receive your order we will give your TradingView account access to our indicators and then you'll see them under the Invite-Only section of your indicators tab on your charts.

4
Add some or all of our indicators to your chart and they will show on every chart you look at. Use the hide/unhide button to only show some indicators on some charts or create different chart layouts with just a few and save them to keep multiple chart layouts open at any time.

Learn Every Indicator With Video Tutorials
Our indicators are designed for traders and investors of all levels. Members get access to
dozens of short video tutorials, showing you exactly how to best use each one.


Start Seeing Markets In a Whole New Way
Get same day access to all 30 of our custom TradingView indicators and start making informed decisions like never before. Join today and unlock the edge you’ve been missing in your trading.
Join Today
-
30 Custom Indicators
-
Video Tutorials
-
Future Updates Included
-
Fast Customer Support
-
7 Days Risk-Free to Test It
Enter your Email and TradingView Username below to Get Access to
All 30 of Our Indicators Today
Frequently Asked Questions
Q - Do I have to be in the United States of America to buy this?
A - No. We have many happy international customers. We use Stripe to process payments, a very large online company that can charge worldwide credit cards in any currency!
Q - What is needed to use these indicators?
A - Only an account with www.TradingView.com (the largest online charting platform) - Please note free TradingView accounts can only view 2 indicators on a chart at a time, we recommend a paid TradingView account which gives many more features and charting benefits. For a small $15-25 monthly fee, it's a needed investment for serious traders and investors.
Q - Can I copy your chart layouts?
A - Yes! after signing up, we'll send you an email with links to our pre-saved chart layouts.
Q - What is the refund policy?
A - You have 7 days to test the indicators out, if you decide they're not for you, you can email us at support@clickcapital.io requesting a refund. Please note you will no longer have access to our indicators and due to rules with our payment processor you will no longer be able to purchase anything else from us in the future.
Q - Do you offer customer support?
A - Yes! If you have any questions or require assistance, email us at support@clickcapital.io, and we will get back to you within 1 business day.